Background:
An unstructured growth model of trichosporon cutaneum is to be developed in
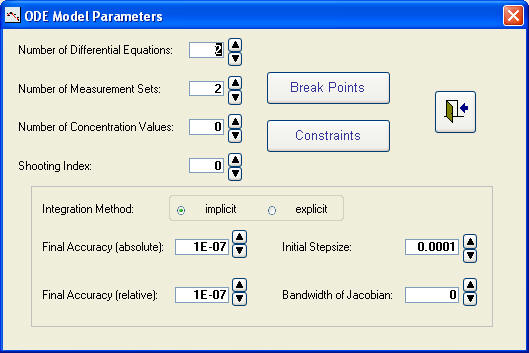
form of a system of two ordinary differential equations.
The Mathematical Model:
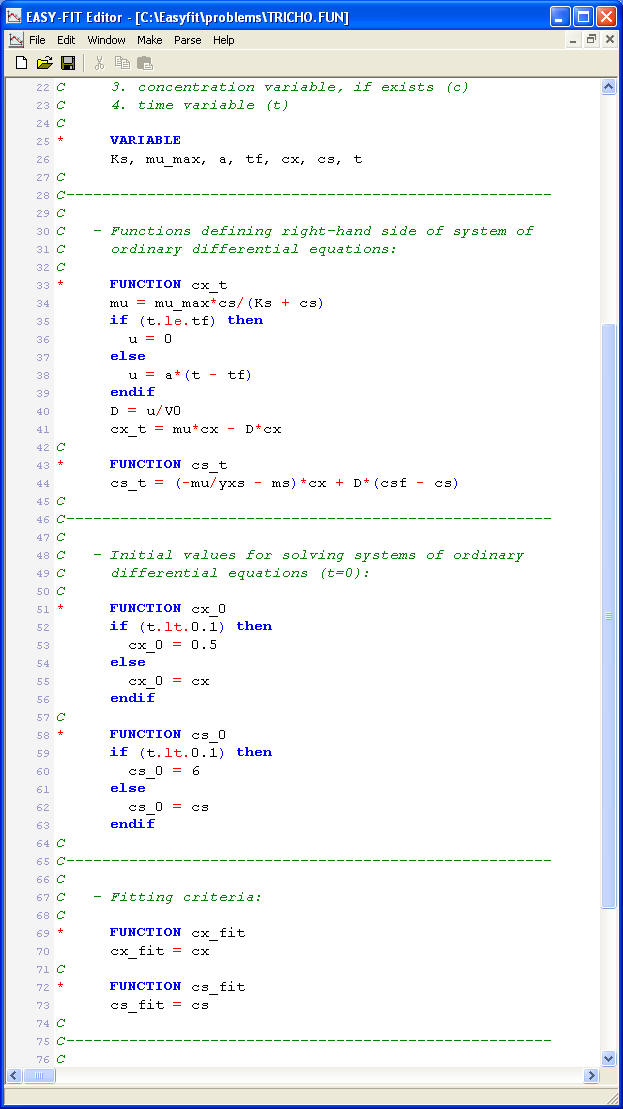
The underlying ordinary differential equations are
cx(t)t = m(t) cx(t)
- D(t) cx(t)
cs(t)t = (-m(t) /yxs
- ms) cx(t) + D(t) (csf - cs(t))
with m(t)
= mmax
cs(t)
/ (Ks + cs(t))
and D(t) = u(t)/V0.
We have u(t)
= 0 if t < tf and u(t)
= a (t - tf) otherwise. Initial
values are cx(0)=0.5 and cs(0)=6.
We have to guarantee that there is a continuous transition at t=tf,
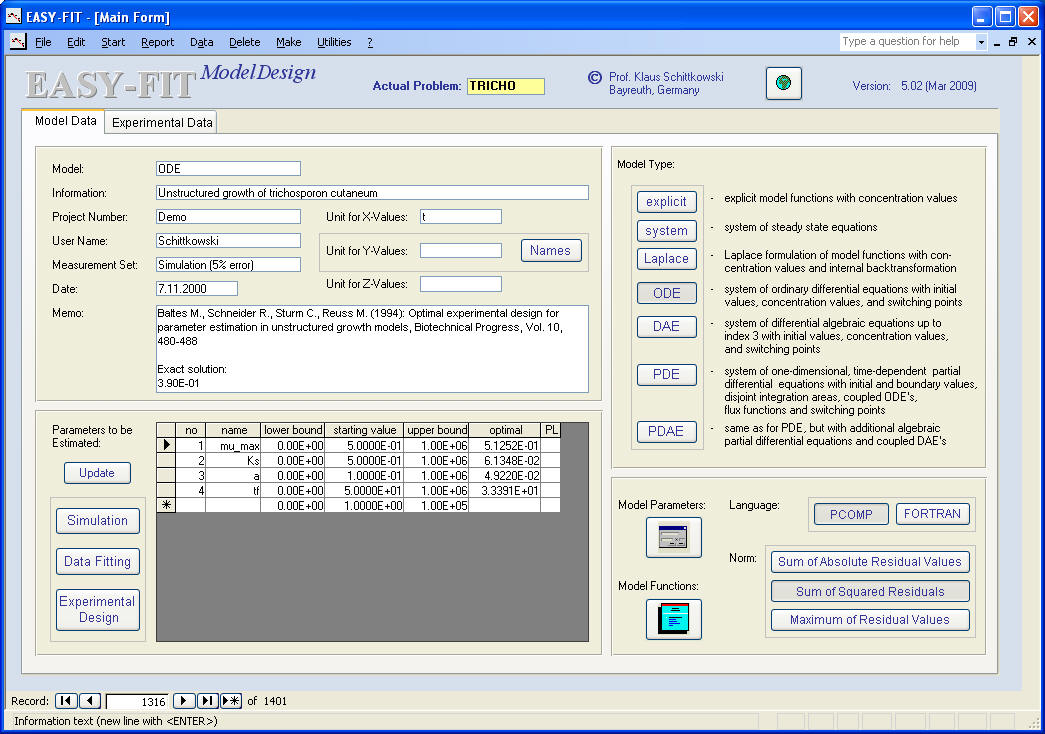
where the model changes. Parameters to be estimated, are Ks,
mmax, a, and an intermediate
time value tf, which is unknown in
advance and where the model changes. The lower index t denotes the
time derivative of the time-dependent state variables cx(t)
and cs(t).
Literature:
Baltes M., Schneider R., Sturm C., Reuss M. (1994): Optimal experimental
design for parameter estimation in unstructured growth models, Biotechnical
Progress, Vol. 10, 480-488
Implementation:
The complete solution of a data fitting problem is described
in six
steps:
Results:
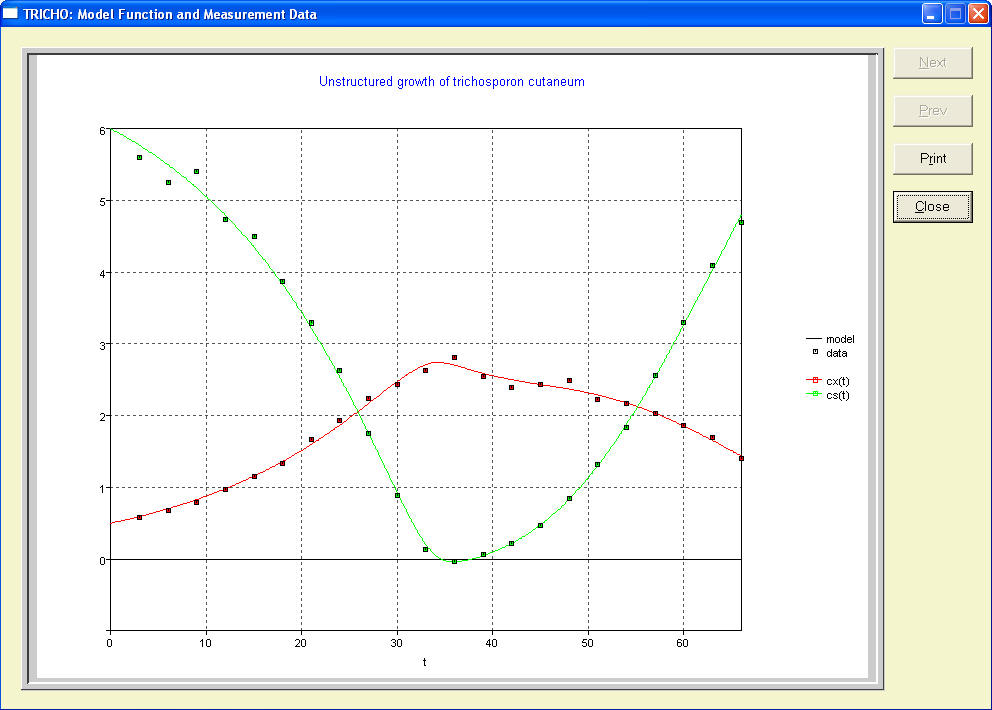
Then you would like to take a look at reports and graphs:
- parameter values
- experimental data versus fitting criterion
Model equations (or use your own favorite editor):
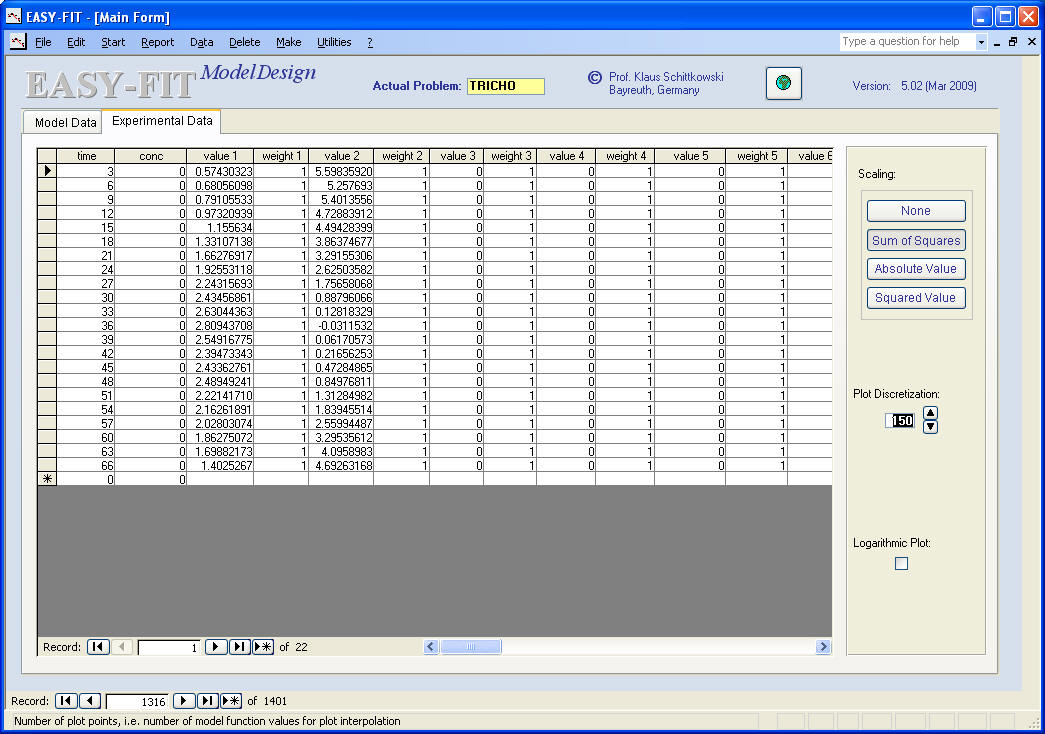
Measurement data (or use import function for text file or Excel):
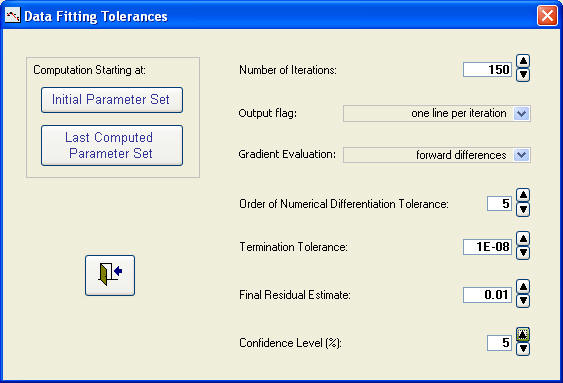
Parameters, tolerances and start of a data fitting run:
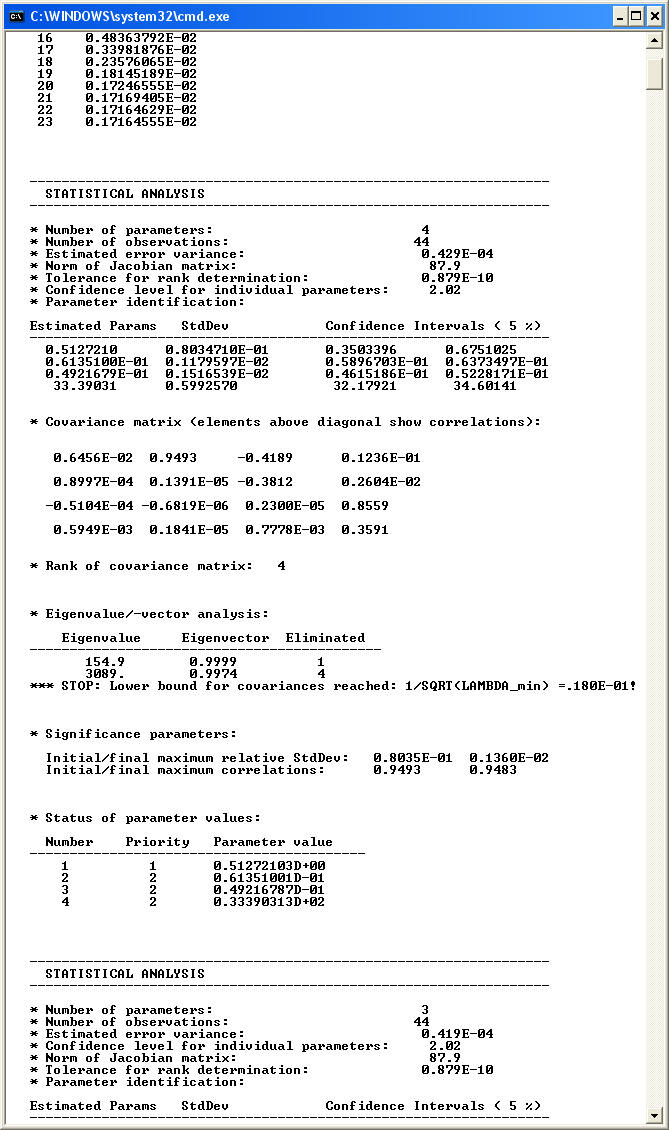
Numerical results (computed by the least squares code DFNLP):
Report on parameter values, residuals, performance, etc. (or export to Word):
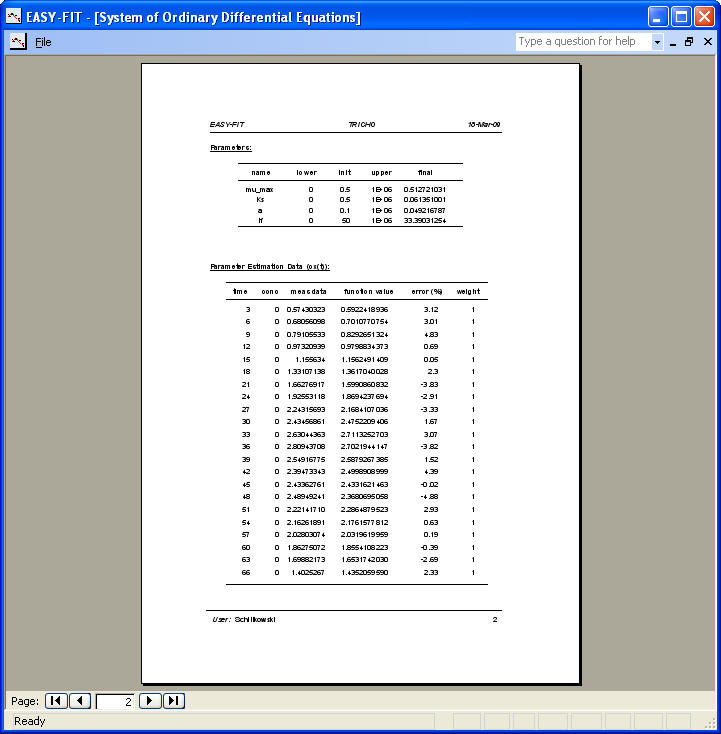
Experimental data versus fitting criterion (also available for Gnuplot):